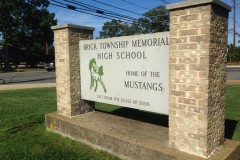
Over the next week, Brick Shorebeat will be examining the state School Performance Reports, which provide a glimpse into the township’s school district. Today, we begin with our first story, examining some vital statistics about our township’s young people. The reports are part of our ongoing Brick by the Numbers series.
~
It’s no surprise: Brick Township’s student population is overwhelmingly white and overwhelming speaks English. Most students will ultimately graduate from high school, though some will face disciplinary issues along the way. But some schools are significantly more diverse than others, and students in certain schools – on average – come from families with an economic advantage over their peers across town.
|
|
Data from the state Department of Education, by way of the department’s School Performance Reports, were released Jan. 30 and provide a glimpse into the academic achievement, college and career readiness and other factors that contribute to the climate in the township’s school district.
The data was calculated based on the 2013-14 school year.
Racial Diversity
While the overwhelming majority of Brick’s students were white, some of the township’s elementary schools showed a more diverse array of racial and ethnic groups, often reflecting the neighborhoods which send students to each school. On average, white students made up about 80 to 85 percent of the population across the board.
Emma Havens Young Elementary School was the township’s most diverse school during the 2013-14 school year, and had the smallest percentage of white students. While the student population was still 72.9 percent white, 17.6 percent of students were Hispanic. Asian students made up 4.2 percent of the population and black students represented 3.6 percent of the population.
The least diverse schools in the district were Midstreams Elementary School and Herbertsville Elementary School, which had student populations that were 90.8 percent and 90.4 percent white, respectively. In both schools, the second-largest group of students were Hispanic, making up 5.8 percent of the Midstreams student population and 3.8 percent of the population at Herbertsville.
After white students, Hispanic students made up the next-highest group across the board. Though it was not the most diverse school overall, Osbornville Elementary School boasted the highest percentage of Hispanic students, at 18.6 percent.
At the township’s two high schools, a good indicator of the overall racial makeup of students district-wide, Brick Township High School was slightly more diverse, with 78.6 percent of students identified as white, 14.8 Hispanic, 3.3 percent black and 2.7 percent Asian. The remainder of students, fractions of percentages of the population, were Pacific Islander and American Indian. At Brick Memorial, 82.8 percent of students were white, followed by 8.4 percent Hispanic, 5.5 percent black and 2.6 percent Asian.
Economic Indicators
Schools had widely-varying percentages of students considered economically disadvantaged, ranging from 15 percent at Herbertsville Elementary School to 47.9 percent at Osbornville Elementary School.
Education officials define an economically disadvantaged student as a student who is eligible for free or reduced-price lunch. Eligibility is dictated by income in relation to family size. For a household of two people, the income limit is $29,101. For three people, it is $36,612, and for a four-person household, the income limit is $44,123.
From least to most, here’s the percentage of students considered economically disadvantaged in each Brick Township school:
- Herbertsville Elementary: 15 percent
- Midstreams Elementary 17.2 percent
- Brick Memorial High School: 22.9 percent
- Primary Learning Center (no longer exists): 25.3 percent
- Veterans Memorial Middle School: 26.7 percent
- Lanes Mill Elementary School: 29.8 percent
- Drum Point Elementary School: 30.7 percent
- Brick Township High School: 33.9 percent
- Veterans Memorial Elementary School: 35.4 percent
- Lake Riviera Middle School: 40.8 percent
- Emma Havens Young Elementary School: 41.3 percent
- Osbornville Elementary School: 47.9 percent
Other Statistics
Regardless of race or income disparity, the vast majority of Brick students will graduate high school, while only a very small percentage will drop out before graduation.
The overall graduation rate at Brick Township High School was 87 percent, a significant percentage though enough for just the 27th percentile statewide and 49th percentile among peer schools, which the state defines as schools that have similar grade configurations and that are educating students of similar demographic characteristics. At Brick Memorial High School, 90 percent of students graduate.
The dropout rate at both schools was low – 1.1 percent at BTHS and 1.7 percent at BMHS.
At BTHS, 11.9 percent of students were suspended at some point during the 2013-14 school year, while 12.5 percent of BMHS students were suspended.
After graduating, 73 percent of both BTHS and BMHS students were enrolled in either two or four year colleges. At BTHS, 56 percent of students who went to college attended a two year school within 16 months of graduating and 43.8 percent attended a four year school. At BMHS, 55 percent of post-secondary students attended a two year college and 45 percent attended a four year school.

Advertisement

Police, Fire & Courts
Teacher From Brick, 36, Charged With Carrying on Affair With Student
Brick Life
Adult Autism Transition

Police, Fire & Courts
Teacher From Brick Charged in Another Sex Affair With Student


